 Skip to main content
If you missed part 1 of this, here it is.
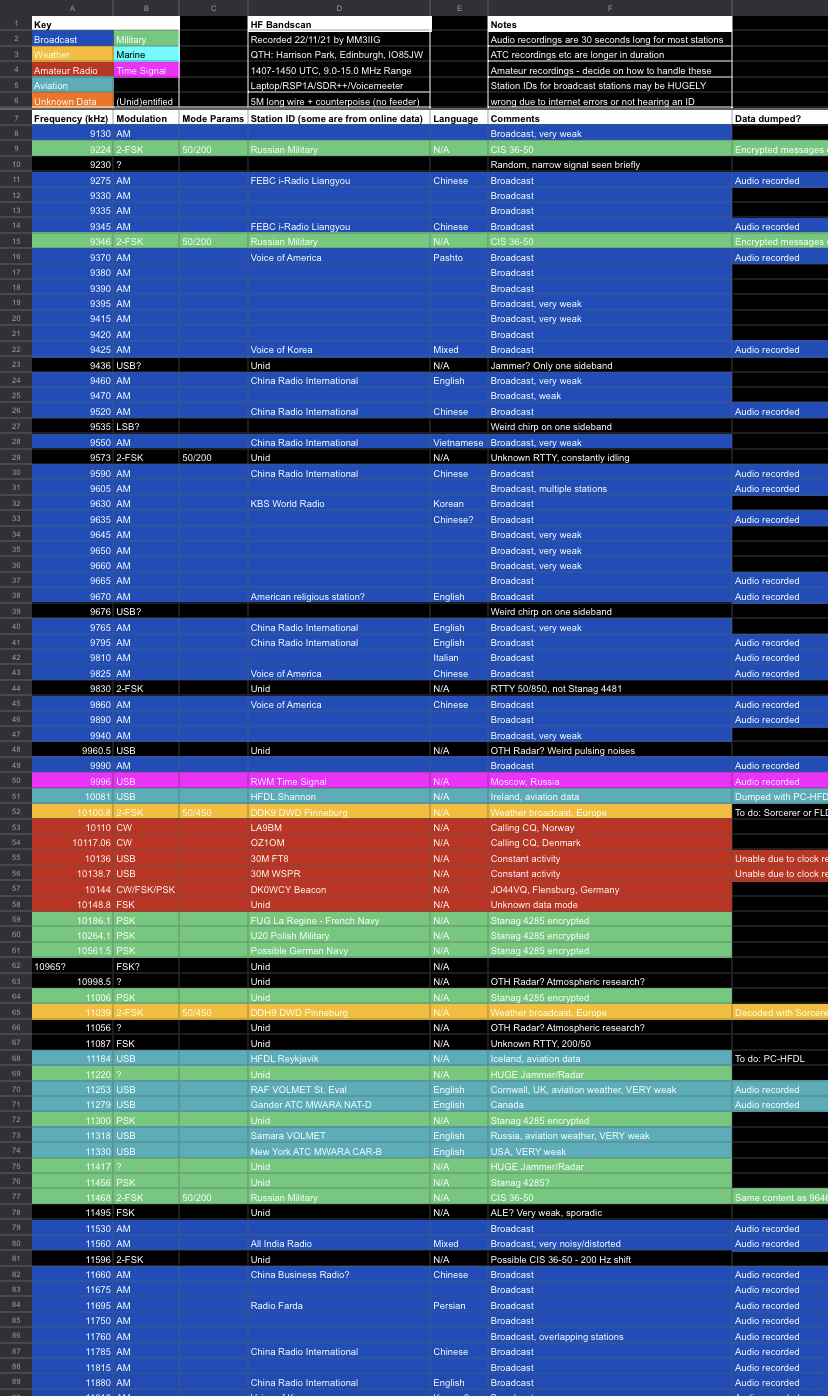
For the purposes of this blog I’m going to be looking at the first spectrum recording I made on the 22nd Nov 2021. It has taken longer than I thought to identify, decode, and confirm parameters for a lot of the log, which also goes some way to showing how much information is available in the data. Indeed, I haven't even finished the sheets for both days yet. All of the signals are (mostly) found and logged, but I havent decoded everything yet, and some signals may never ne decoded or confirmed.
This isn’t always the case, and there are countless examples of things seemingly “out of band” from where they should be. Some of these bands are shared allocations, but sometimes things appear to just be in the wrong place. Occasionally these stations are legacy arrangements that just survive to the day. Sometimes they are clandestine in nature.
The number of individual signals I seem to have picked up would seem to be around 300-350, it’s hard to say exactly. There were many signals consisting of just a weak carrier with no discernible audio. Sometimes these turned out to be images of other signals produced within the electronics of the SDR. Others exhibited fading as the conditions changed in real time, confirming them as genuine. If I counted all of those I’d have many, many more lines in the log.

It’s worth remembering that this was supposed to be a kind-of art project as much as anything else, and I’m really surprised how much information there is in here. The audio of the broadcast stations alone would seem to be a useful snapshot of the world on that day, from locations as diverse as Africa, Eastern Europe and Asia. The movement of the aircraft is a huge treasure trove of data. The weather reports and fax images, while a little hard to understand in their broadcast format, are very interesting, and it makes me think of some guy on a small boat out at sea with a little radio and a printer, waiting to see if he can come home safely yet.

In later posts I’ll be going through each category of signal and looking at the decoding of them and noting what I’ve learnt along the way. Hopefully the verbose journey I’m taking you on is useful if you’re also getting into this yourself and looking for ideas. It goes without saying that other people on the internet have much more to say and it will be more useful, but it will stand along as a log of my own progress too so I can compare the results later.
I’ll also post some updates about further work that I’ve completed since - the 9:1 unun arrived and I have used it to great effect with much lower noise and just as many signals coming in. I have also experimented with using a length of RG58 feedline and a clip-on ferrite choke to start the antenna higher up rather than on the ground, allowing for a more horizontal configuration. This helped a great deal, and the SWR curves seen in the last post started to drop, revealing a better match across huge sections of the HF bands. Pulling the antenna to a more straighter, tighter setup was, I found, also very important.
I *think* we’ll do the weather fax stations first, because they’re all decoded and there aren’t many of them. When I get around to writing it. There was also a VERY nice surprise in there...
Comments
Post a Comment